In this puzzle, we’re going to learn how to create a cross tab query using SQL Server. Cross tabs are a great way to summarize data. And given that Business Intelligence is a hot topic, knowing how to create one is key.
We’ll learn to create a cross tab query. Before you read the entire article, try the puzzle. Any work you do, if it you just get part of the answer, helps to reinforce the concepts you’ll learn.
Solving puzzles is a great way to learn SQL. Nothing beats practicing what you’ve learned. Once you have figured out the puzzle, post your answer in the comments so we all can learn from one another. We also discuss puzzle and more in Essential SQL Learning Group on Facebook. Be sure to find us there!
SQL Puzzle Question
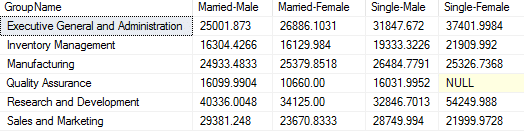
The Adventure Works human resources director is starting a wage study. As part of this study, she would like a summary of annual wages by Department Group name and Life Status.
For our purposes, Life status is defined the combination of marital status and gender (e.g. Married-Male, Married-Female).
Using the AdventureWorks database as the basis for your answer, what SQL would you write to product the following table?
Answer Using Cross Tab Query
Before we get into how to create the cross tab query, let’s first define the underlying query we’ll use as a source.
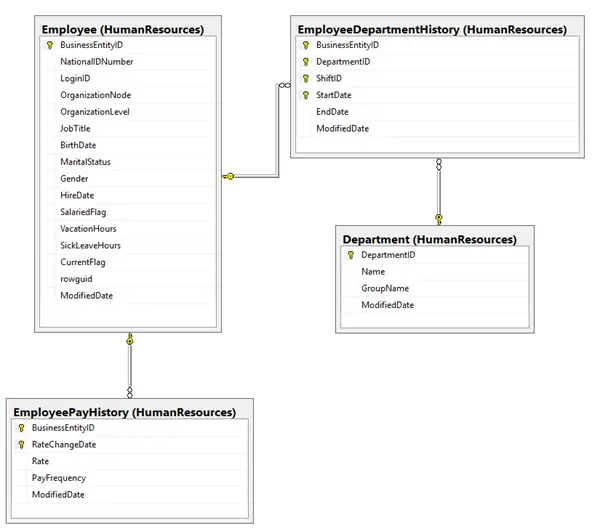
Once you study the adventure works database you’ll notice there are several key tables you’ll need to do your search. To help understand the database relationships, let’s create a database diagram.
These diagrams really help you understand relationships, and come in handy when writing the queries.
Below is the one to use for this puzzle. Notice how the Employee table is central to the query. Related to this are two separate dimensions, the first being pay history, the second, employee department history.
Cross Tab Query Detail Rows
The first step in putting together the summarization is to construct the query used to pull in the detailed data. After you study the diagram, you’ll see we’ll need several joins per the relationships shown.
To make it easier to read, I color coded the SQL inner joins related to pay history in red, and those with department group name in blue.
SELECT E.BusinessEntityID,
       D.GroupName,
       H.EndDate,
       E.MaritalStatus,
       E.Gender,
       P.Rate,
       P.PayFrequency,
       P.RateChangeDate,
       P.Rate * 40 * 52 / P.PayFrequency as AnnualPay
FROM   HumanResources.Employee E
       INNER JOIN HumanResources.EmployeePayHistory P ON
                  E.BusinessEntityID = p.BusinessEntityID
       INNER JOIN HumanResources.EmployeeDepartmentHistory H ON
                  E.BusinessEntityID = H.BusinessEntityID
       INNER JOIN HumanResources.Department D ON
                  H.DepartmentID = D.DepartmentID
WHERE  E.CurrentFlag = 1;
There are several issues with this result. First, the query is returning more than one row per employee. To avoid double counting summary results, there should be a single row.
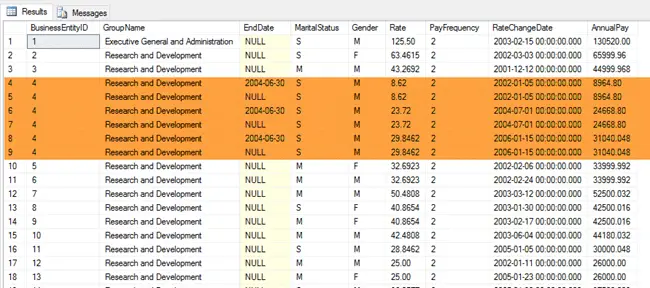
This is due the query returning each employee’s complete pay and departmental history. Multiple records, for one employee are included in the result – one for each pay raise or departmental move.
Removing Duplicates from Cross Tab Query Detail Results
The results should contain the latest pay and department for each employee.
The latest department, the once corresponding to the department history with a NULL end date. Adding a filter to the join condition addresses this issue.
To only select the latest pay rate, we’ll partition the data by employee (BusinessEntityID) sorted by RateChangeDate. With the data sorted in descending order, the latest pay is always ROW_NUMBER() = 1.
Wrapping this query in a CTE (Common Table Expression) allows us to query the detailed data and filter on the partitioned data. This means we can select rows where ROW_NUMBER() = 1.
With cte_EmployeePay as
(
   SELECT E.BusinessEntityID,
          D.GroupName,
          H.EndDate,
          E.MaritalStatus,
          E.Gender,
          P.Rate,
          P.PayFrequency,
          P.RateChangeDate,
          P.Rate * 40 * 52 / P.PayFrequency as AnnualPay,
          ROW_NUMBER() OVER(PARTITION BY E.BusinessEntityID
                       ORDER BY P.RateChangeDate Desc) RowNumber
   FROM   HumanResources.Employee E
          INNER JOIN HumanResources.EmployeePayHistory P ON
                     E.BusinessEntityID = p.BusinessEntityID
          INNER JOIN HumanResources.EmployeeDepartmentHistory H ON
                     E.BusinessEntityID = H.BusinessEntityID
                     AND H.EndDate is NULL
          INNER JOIN HumanResources.Department D ON
                     H.DepartmentID = D.DepartmentID
   WHERE  E.CurrentFlag = 1
)
SELECT *
FROM   cte_EmployeePay
WHERE  RowNumber = 1;
Using a common table expression makes this easier to manage and we avoid having to create a view of the partitioned data. Now our results show the latest pay and departmental assignments.
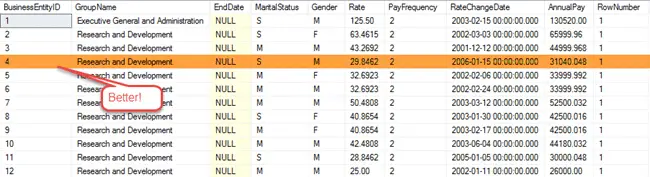
Notice there is just a single row for BusinessEntityID 4.
The final step is to create a cross tab query. I choose to create one using the PIVOT statement.
To prepare my data, I calculated the LifeStatus by combining MaritalStaus with Gender.
You see further on in the pivot statement I explicitly call out each combination. This makes it a static pivot table. In a later puzzle, we’ll learn how construct a dynamic pivot.
Using PIVOT to Create a Cross Tab Query
We’re now able to put together the summary data using a PIVOT. To help you read the query, I’ve color coded the source query gray.
The PIVOT is color coded Blue.
With cte_EmployeePay as
(
   SELECT D.GroupName,
          IIF(E.MaritalStatus = 'M','Married','Single') + '-' +
          IIF(E.Gender = 'M', 'Male', 'Female') as LifeStatus,
          P.Rate * 40 * 52 / P.PayFrequency as AnnualPay,
          ROW_NUMBER() OVER(PARTITION BY E.BusinessEntityID
                       ORDER BY P.RateChangeDate Desc) RowNumber
   FROM   HumanResources.Employee E
          INNER JOIN HumanResources.EmployeePayHistory P ON
                     E.BusinessEntityID = p.BusinessEntityID
          INNER JOIN HumanResources.EmployeeDepartmentHistory H ON
                     E.BusinessEntityID = H.BusinessEntityID
                     AND H.EndDate is NULL
          INNER JOIN HumanResources.Department D ON
                     H.DepartmentID = D.DepartmentID
   WHERE  E.CurrentFlag = 1
)
SELECT *
FROM   (SELECT GroupName,
               LifeStatus,
               AnnualPay
        FROM   cte_EmployeePay
        WHERE  RowNumber = 1) as SourceTable
PIVOT
(
   Avg(AnnualPay)
   FOR LifeStatus IN ([Married-Male],
                      [Married-Female],
                      [Single-Male],
                      [Single-Female])
) AS AvgSales
ORDER BY GroupName
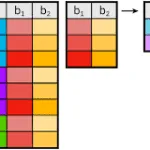
Notice that the PIVOT operator takes the derived table, which is named SourceTable, as input and “rotates” the LifeStatus values from rows to columns.