We are going to learn how to create a bar chart using SQL server in this puzzle. It can sometimes be fun to see what you can do with the SELECT statement. Besides, I figured it would be fun to see if I could create an “old-fashioned” bar chart — this is much like what we used to do with the dot-matrix printers!
Being able to practice solving puzzles in real-time is a great way to learn SQL. In fact, nothing beats practicing what you’ve learned. Once you have figured out the puzzle, kindly post your answer in the comments section so we can all learn from one another. You will be able to learn more about the puzzle in more detail in the Essential SQL Learning Group on Facebook. Be sure to find us there!
SQL Puzzle Question
Let’s say, you and a couple of parents have organized a game tournament for your kids. These kids were assigned teams with each team playing five rounds of games. As soon as the rounds are completed, it is time to determine the overall winning team!
Now, your job is to create a bar chart to show each team’s average scores. The team with the highest average winning score is declared as the overall winner.
The games data is housed in the @teamscore table:
DECLARE @TeamScore TABLE
(
   Team Varchar(20),
   Game Int,
   Score Int
)
The bar chart you’re aiming to produce should look like this:
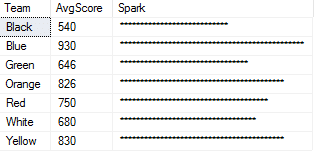
Are you up for the challenge of creating this chart using a SELECT statement?
BONUS Question!
Modify the display so that the bar will start at the minimum score. It should indicate where the average lies and ends at the maximum score. Refer to the image below as an example:
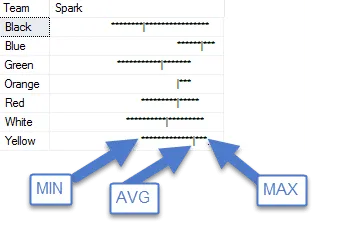
Again, only single SELECT statement need to be applied.
If you wish, you can use this script to get started.
Good luck!
Answer to SQL Puzzle Question
To answer the question, we will break the problem down into several steps.
Step 1: Determine the average score. In order to do this, use the AVG aggregate function along with GROUP BY.
SELECT Team,
       Min(Score) MinScore,
       AVG(Score) AvgScore,
       Max(Score) MaxScore
FROM   @TeamScore
GROUP BY Team
Here are the results:
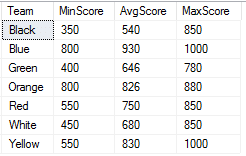
Now that we have the average scores, we can go to step #2.
Step 2: Start focusing on building the bar. Given that the scores are so large, it isn’t practical to have each point represent a star. What we need to do is come up with a scaling factor. The scaling factor describes the number of points where each start represents.
For our example the scaling factor is the maximum number of points attained divided by fifty.
The maximum number of points is calculated using this query:
SELECT MAX(SCORE) FROM @TeamScore
We’ll include this in our example as a sub query to avoid hard-coding the maximum score. For our purposes, the scaling factor is:
50.0 / CAST((SELECT MAX(SCORE) FROM @TeamScore) as float)
Note that, we’re converting our maximum score to a float datatype. This is to bring the result in decimal form rather than having the result show to the nearest integer.
We can use the REPLICATE command to build the bar. It makes it easy to repeat a set of characters. For instance,
SELECT REPLICATE(‘*’,50)
Returns *************************************************
So now, all we need to do is multiply the team’s average score by the scaling factor and use this result as a parameter to the REPLICATE function to build our bar.
Here is the final query showing the result:
SELECT Team,
       AVG(Score) as AvgScore,
       REPLICATE('*', ROUND(CAST(AVG(Score) AS float) * 50.0 /
          CAST((SELECT MAX(SCORE) FROM @TeamScore) as float),0))
          as Spark
FROM   @TeamScore
GROUP BY Team
To make it easier to read, I colored the average score green and the scaling factor blue.
Answer to Bonus Question
In order to be able to answer the bonus question, we will use what we have learned from solving the original question and build from there.
In this case, instead of building a solid bar of start to represent the average score, we need to have the bar extend to the team’s maximum score. The trick is at the start – it should start as their minimum score.
For us to be able to do this, we build up the base by replicating spaces until we reach the minimum score. At this point, we replicate stars until the maximum score is reached.
Here is the bit used to build up the spaces:
REPLICATE(' ', ROUND(CAST(MIN(Score) AS float) * 50.0 /
   CAST((SELECT MAX(SCORE) FROM @TeamScore) as float), 0))
Here is how we calculate the number of stars between the minimum and maximum scores.
REPLICATE('*', ROUND(CAST((MAX(Score) - MIN(Score)) AS float) * 50.0 /
   CAST((SELECT MAX(SCORE) FROM @TeamScore) as float), 0))
This is the same technique we used before, except now we are only interested in building the start from the minimum score to the maximum score. In order to do this, we just take the difference. For us to build the bar, we just concatenate the space based with the stars.
Now that we have gotten the bar build, we have an issue; and that is, how do we indicate the team’s average score? This should be located somewhere in the middle of the bar, but who do we place there?
STUFF to the Rescue!
Fortunately, we can use the STUFF built-in function to replace a character with another from the chosen position.
Given this, we can take the bar that was built and then knowing the position that represents the team’s average score, we will exchange it with a “|”.
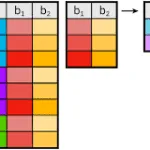
To help you understand how this all works, I put together a diagram showing how a bar is built
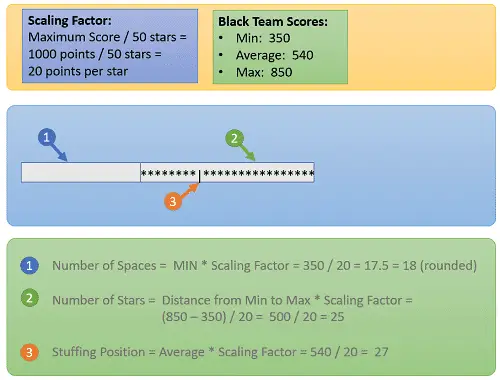
Now for the answer to the bonus question!

 SELECT Team,
        STUFF( REPLICATE(' ', ROUND(CAST(MIN(Score) AS float) * 50.0 / CAST((SELECT MAX(SCORE) FROM @TeamScore) as float), 0)) +
           REPLICATE('*', ROUND(CAST((MAX(Score) - MIN(Score)) AS float) * 50.0 / CAST((SELECT MAX(SCORE) FROM @TeamScore) as float), 0)),
           CAST(ROUND(CAST(AVG(Score) AS float) * 50.0 / CAST((SELECT MAX(SCORE) FROM @TeamScore) as float), 0) as int),1,'|') as Spark
 FROM   @TeamScore
 GROUP BY Team
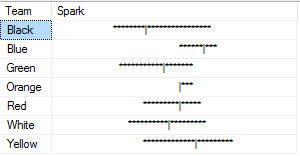
Which produces these results:
As a summary, there are several concepts I used to answer this question:
- GROUP BY to summarize scores
- The REPLICATE function to repeat characters, such as an asterisk or star (*)
- A subquery to find the maximum score.
- Data conversion functions
- STUFF function to replace one character in a string with another.