Recently a student asked me how he could calculate a Moving Median. It’s not as easy as you think, as SQL doesn’t provide a built-in MEDIAN() function, nor an easy way calculate the “moving” aspect.
In this article we’ll calculate a Moving median using SQL Server. Let’s use the PizzaDB sample database for example data.
SQL Moving MEDIAN
Like a moving average, a moving median is based on a window of rows with “moves” or slide down the result set. As you look at the diagram below, you’ll see we’re calculating a five-row moving median.
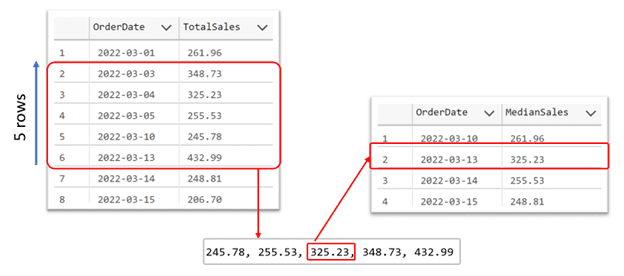
In row Six we’re able to calculate the median using rows 6 through 2. Given the Median, returns the “middle” value of a sample, the moving five row median at row six is 3.25.23.
Read More: SQL MEDIAN in SQL Server
Plan of attack
Since there is no built-in function to calculate median we need to come up with another way. Luckily, aw can use PERCENTILE_CONT() to do so. We’ll use it to calculate the 50th percentile rank, which, happens to be the median.
You can see it work here.
Ok, so now that we know what function to use, the next big issue is how to create a “moving” median. Unlike average, AVG(), we there isn’t a directly way to use ROWS PRECEEDING to create the moving window.
We’ll have to do this part by hand:
- Associate Row Numbers to each observation
- For each unique OrderDate, create a range of row numbers defining the window
- Combine the Observations with ranges.
- Calculate Mediate within each range.
In the end we’ll end up with a single query using several derived tables, it a lot to digest at once, so let break it down into steps. By the end you’ll understand all the pieces and have a fully working query to use!
Step 1 – Associate Row Numbers to each observation
To create windows, we’ll first create a row number for each observation. In this query you can see how this is done. Just use the row_number() window function. Also, notice order the row numbers by OrderDate.
  select o.*, --observations
        row_number() over(order by OrderDate) RowNum
    from
    (
        select OrderDate, sum(FinalOrderPrice) TotalSales
        from CustomerOrderSummary
        group by OrderDate
    ) o
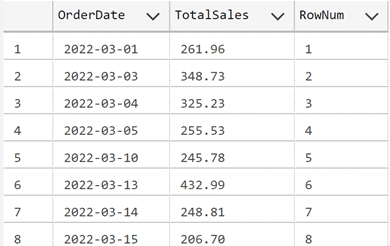
Another part of the puzzle is to come up with “windows” or ranges of rows for each observation. For instance, in our very first example our window started at 6 and we back to row 2. In this follow query we create these windows.
select r.*  --moving ranges
    from
    (
        select d.*,
            row_number() over(order by OrderDate) - 4 RowStart,
            row_number() over(order by OrderDate) RowEnd -- end of moving range
        from
        (
            select distinct OrderDate
            from CustomerOrderSummary
        ) d
    ) r
    where RowStart  > 0 -- only keep ranges that make sense
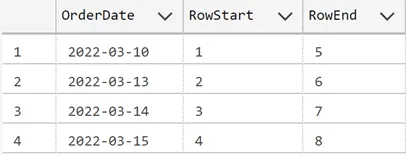
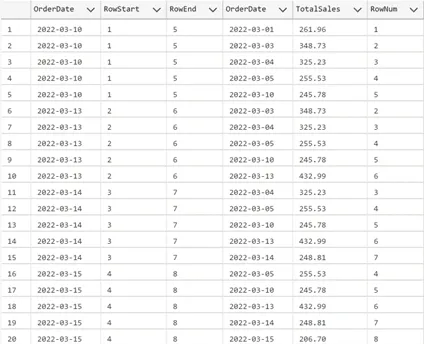
Now that we have these two pieces, we can combine them together to make our solution the idea we use the row ranges to “select” rows to calculate the median. We’ll do this by using a non-equi join.
The idea is to join on Rownumber where the value is between the RowStart and RowEnd values. Doing so gives us relevant observations to calculate the median.
The join looks a bit strange since we’re joining two derived tables!
The tables are aliased r and o for range and observation respectively.
If this seems a bit hard for you to get, just keep in mind the derived tables return results. So think of use joining those results, think of them as being tables, if it makes it a bit easier for you.
Check out the following query to see how we get the data setup to start the calculations.
--data prepared
select r.*, o.*
from (
    select d.*,
        row_number() over(order by OrderDate) - 4 RowStart, -- start of moving range
        row_number() over(order by OrderDate) RowEnd        -- end of moving range
    from (
        select distinct OrderDate
        from CustomerOrderSummary
    ) d
) r
    inner join (
        select *, row_number() over(order by OrderDate) RowNum --observations
        from (
            select OrderDate, sum(FinalOrderPrice) TotalSales
            from CustomerOrderSummary
            group by OrderDate
        ) d
    ) o on o.RowNum between r.RowStart and r.RowEnd
where RowStart  > 0 -- only keep ranges that make sense
Notice how the observations repeat between RowStart and RowEnd ranges?
Let’s calculate the Mean. To do this we’ll use the percentile_cont() window function.
I cover how this works in this cook book article.
All the hard work is done. All that remain is to setup percentile_cont() and partition it on r.OrderDate.
Recall that r.OrderDate stands for the “moving windows” we manually created. By partitioning on these, we calculate the median
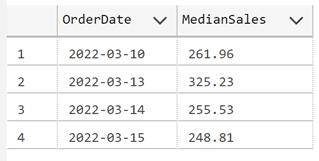
select distinct r.OrderDate,
percentile_cont(.5)  within group (order by TotalSales)
                                   over(partition by r.OrderDate) MedianSales
from (
    select d.*,
        row_number() over(order by OrderDate) - 4 RowStart, -- start of moving range
        row_number() over(order by OrderDate) RowEnd        -- end of moving range
    from (
        select distinct OrderDate
        from CustomerOrderSummary
    ) d
) r
    inner join (
        select *, row_number() over(order by OrderDate) RowNum --observations
        from (
            select OrderDate, sum(FinalOrderPrice) TotalSales
            from CustomerOrderSummary
            group by OrderDate
        ) d
    ) o on o.RowNum between r.RowStart and r.RowEnd
where RowStart  > 0 -- only keep ranges that make sense
Related Articles:



Leave a Reply